
Streamflow and frequency, self-formed channels, and geomorphically effective discharge
Streamflow statistics and river-channel form are closely linked.
Learning Goals
- Relate stage and discharge.
- Know the basics of flood-frequency analysis
- Know that the geomorphically-effective flood of the recurrence interval that moves the most material. For most rivers, this is the 1–2-year return-interval flood, and corresponds to the bankfull flood.
- Realize that river channels self-adjust to carry the geomorphically effective flood: the form of the landscape responds to the dominant hydrological driver!
Measuring river discharge
Images borrowed from Thomas Brikowski, UT Dallas.
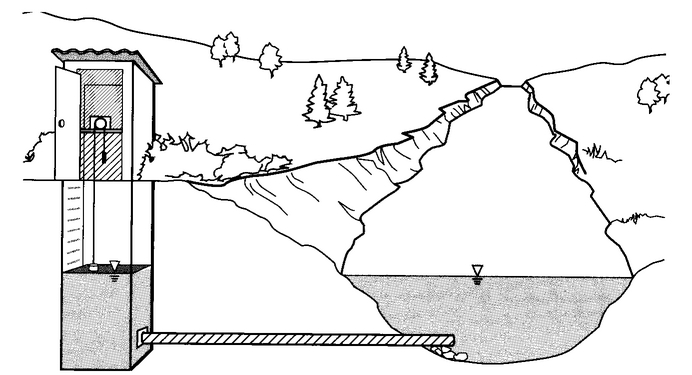
Measuring the flow (i.e., the discharge) in a river is difficult. Measuring its water level (called stage), on the other hand, is relatively easy. Stage measurements can be made using:
- Paired pressure transducers, one to measure the pressure below the water surface (water + air) and one in the atmosphere to measure the air pressure alone. By subtracting these two, we can obtain water depth.
- Laser rangefinders to measure the distance to the river surface
- Stilling wells with floats, such as the one shown in the picture below. Originally, these mechanically moved a writing implement across an advancing strip chart. Now, a digital encoder records the number and direction of pulley rotations, and converts this into a water level.
 From Sanders (1998), A Manual of Field Hydrology.
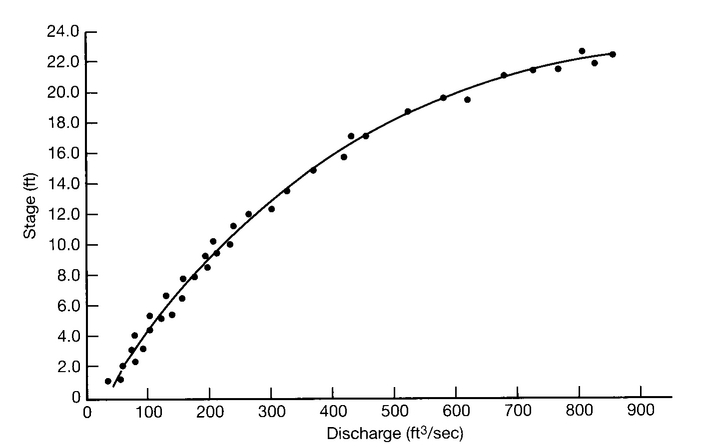
These measurements must then be converted into discharge in some way. Empirically, this is done by measuring the river discharge at multiple river stages and constructing a rating curve such as the one below:
 From Sanders (1998), A Manual of Field Hydrology.
Note the nonlinearity: as stage becomes higher, a subtle increase in stage produces a larger increase in discharge. This can be due to one of two reasons:
- Flow velocities increase as the flow becomes deeper; recall Manning’s Equation and the Law of the Wall
- The channel/valley geometry typically becomes wider as the water surface increases in elevation
Impact of channel and valley geometry on river stage and discharge
Towards point 2, above, let us consider how valley geometry might impact the relationship between water level (stage) and river discharge.
 From Verry et al. (2004), Riparian ecotone: A functional definition and delineation for resource assessment; figure modified from Smith, D. S. and Hellmund, P. C.: 1993, Ecology of Greenways: Design and Function of Linear Conservation Areas, University of Minnesota Press.
In-channel flow: velocity and depth
While the flow remains in the channel, an increase in stage will result in faster flow (cf., Manning’s equation or the law of the wall). As a quick reminder using Manning’s equation:
\[\bar{u} = \frac{1}{n} h^{2/3} S^{1/2},\]where \(\bar{u}\) is mean flow velocity, \(n\) (“Manning’s n”) is a roughness coefficient, \(h\) is flow depth, and \(S\) is water-surface slope, which for steady, uniform flow parallels the bed slope.
Recalling the definition of discharge (\(Q\)) and approximating the channel as rectangular:
\[Q = b h \bar{u},\]where \(b\) is channel width. Combining these two equations together provides:
\[Q = \frac{b}{n} h^{5/3} S^{1/2}.\]This means that an increase in stage leads to a disproportionate increase in discharge, to a 5/3 power.
This behavior continues until the flood in the river reaches a bankfull stage – that is, the level at which its elevation equals the top of the surrounding river banks.
Overbank flow:
After flow in the river overtops its banks, “overbank” flow begins (no kidding!). This flow expands to cover the entire width of the valley. There is now so much space for the water to go that an increase in discharge will create only a small increase in flow depth.
Flood frequency and streamflow statistics
Once we can measure discharge (or stage, which can be more important when thinking about inundation extent), we can then compare a time series of river-discharge data to analyze the statistics of flows of different magnitudes.
Hydrograph
This hydrograph shows streamflow (i.e., river discharge) over time. Each peak is considered to be a specific flood event.
 Source: SERC.
Flow-duration curve
The flow-duration curve shows the fraction of each year that the flow exceeds some threshold amount. Large floods are on the left (low fraction of the year exceeded, high discharge). In the below figure, flows exceeded more frequently than around 40% of the year start to collapse; this is the “base flow” related to the stock of groundwater for that year (fed by rain and snowmelt over the prior season or seasons) that discharges to the river.
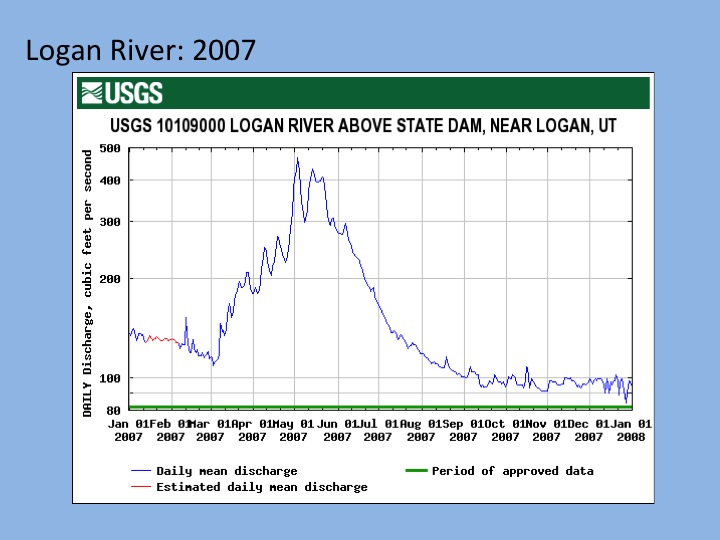
 Text from SERC: “Flow duration curves for the Logan River, in northern Utah for four different years. As the Logan River is a snow-melt dominated system, observed differences in high flows each year (left side of plot) correlate to differences in snowpack in each of the years.
Source: Patrick Belmont”
Text from SERC: “Flow duration curves for the Logan River, in northern Utah for four different years. As the Logan River is a snow-melt dominated system, observed differences in high flows each year (left side of plot) correlate to differences in snowpack in each of the years.
Source: Patrick Belmont”
Flood-frequency analysis
After collecting data for a river over time, it is possible to find how frequently a flow of that magnitude occurs. This can then be plotted to determine flood frequency. Using the peaks in the hydrograph, the maximum discharge of each flood may be plotted against the recurrence interval – that is, the expected average time between two events of that magnitude.
 From SERC.
Note that it is possible to have two 50-year floods that occur in consecutive years, and then not to have another one until 100 years later: this is a central tendency, not a deterministic period.
This plot uses a log x axis. Therefore, every unit distance on the x axis indicates a factor of 10 reduction in the probability of a distinct flood.
Geomorphic work
Geomorphic work is the amount of material eroded and/or transported. (It is not defined in the same way as “work” in physics; someday my persnickety side might feel inspired to write a paper to formalize its definition. For the moment, please just live with the strange wording.)
When does the most geomorphic work occur?
A small flow occurs frequently, but is often not capable of causing much erosion or moving much material.
A large flood is capable of eroding significant material, but might not occur very frequently – so the total time of that erosion can be reduced.
In a classic study by Wolman and Miller (1960), Magnitude and frequency of forces in geomorphic processes, the authors considered this Goldilocks problem.
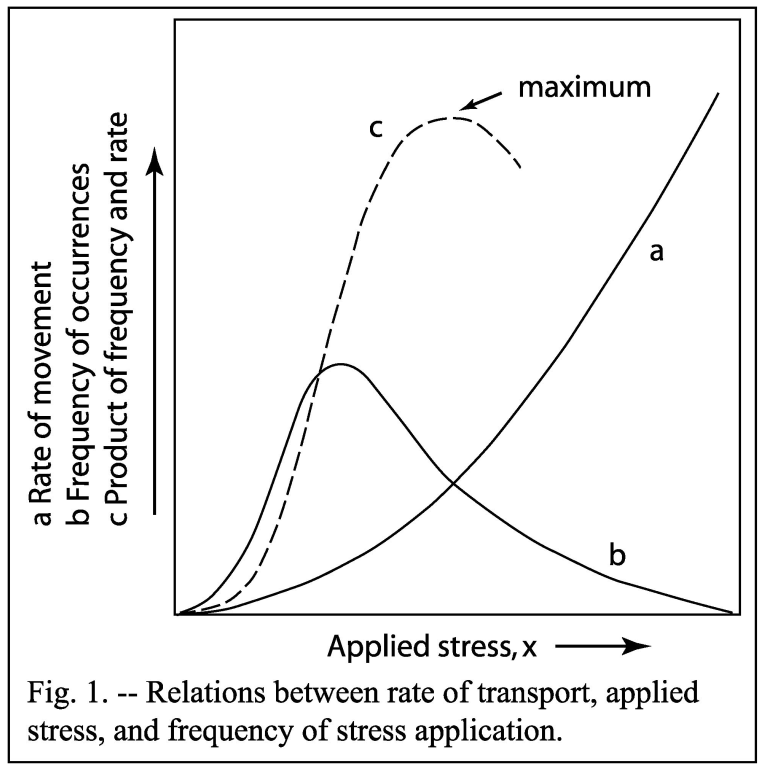
- The x axis is the applied stress. For steady, uniform flow – a good assumption here – this can be considered to be \(\tau_b = \rho g h S\).
- Line a is the rate of sediment transport. Note that this is nonlinearly proportional to applied stress – that is, when \(\tau_b\) (x axis) doubles, a more than doubles. This nonlinearity means that large floods are extra effective at moving sediment.
- Line b is the frequency that some stress will occur. This requires taking a couple of pieces of information into account:
- Small floods are more frequent than large floods (see above).
- Shear stress is proportional to flow depth, and flow depth does not increase linearly with river discharge (see above), especially when the channel is inset within a floodplain.
- Line c combines lines a and b to demonstrate that an intermediate flood – one that is greater than an everyday flow but still occurs with some frequency – produces the most time-integrated geomorphic work.
For most rivers, the flood performing the majority of the geomorphic work is the 1–2-year flood.
Self-formed channel geometries
An astounding observation is that this 1–2-year flood fills most river channels precisely to bankfull stage. That is, river channels adjust their widths, depths, and slopes to accommodate this geomorphically effective flood.
The fluvial landscape adjusts in response to its hydrological drivers.

This work is licensed under a Creative Commons Attribution-ShareAlike 4.0 International License.